


Last updated: August 30, 2026
By Ben Argeband, Founder & CEO of Heartbeat.ai — This is meant to be spreadsheet-simple. A recruiter should be able to run the math in about five minutes.
What’s on this page:
Who this is for
You lead recruiting or recruiting ops and someone is asking you to justify spend on provider contact data. This is a measurement workflow you can run monthly to show unit economics — not activity — and to compare sources fairly.
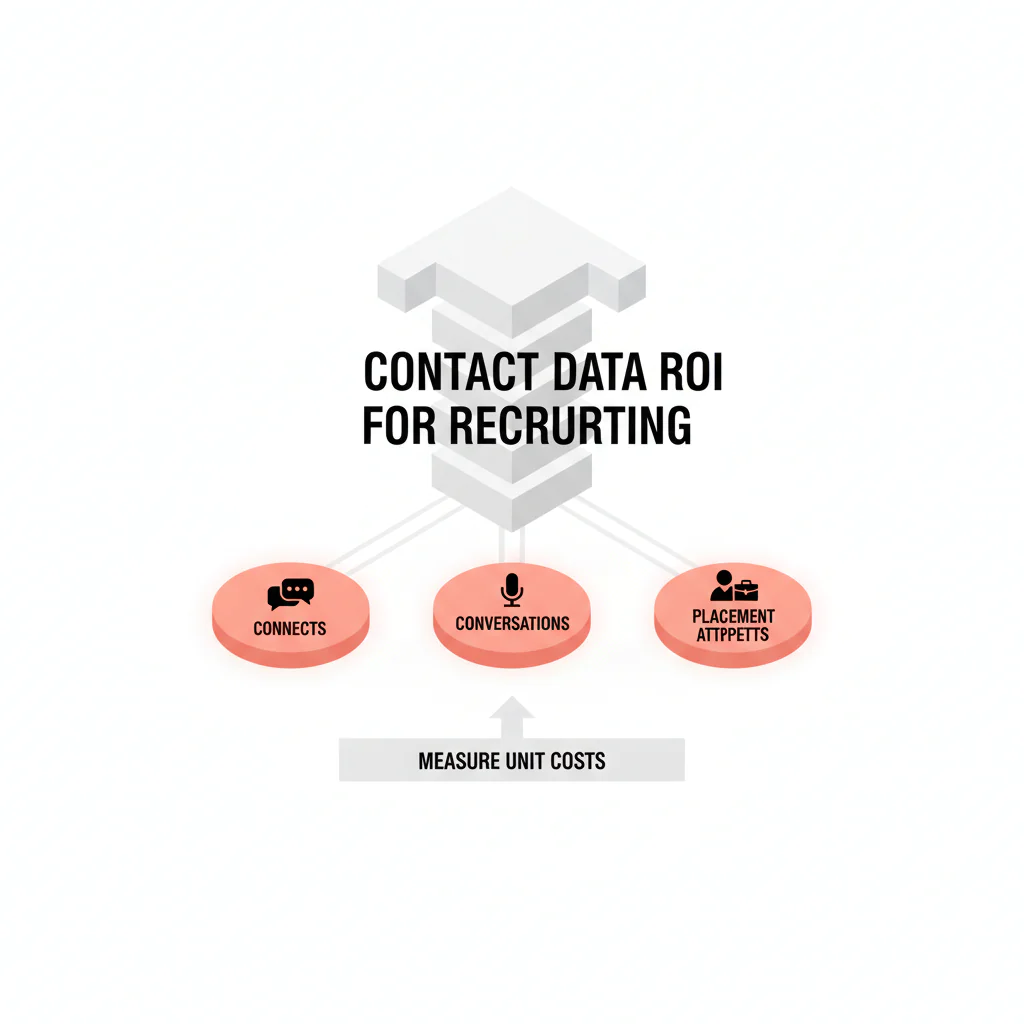
The focus is outcomes: connects, qualified conversations, and placement attempts, plus the admin time you lose when contact records are stale or duplicated.
Quick Answer
- Core Answer
- Measure ROI by calculating cost per connect, cost per conversation, and cost per placement attempt, including admin time caused by bad data and rework.
- Key Insight
- Contact data ROI improves fastest when you price wasted attempts and admin rework into unit costs, then compare sources on the same 30-day window.
- Best For
- Recruiting leaders justifying spend on provider contact data.
Compliance & Safety
This method is for legitimate recruiting outreach only. Always respect candidate privacy, opt-out requests, and local data laws. Heartbeat does not provide medical advice or legal counsel.
The short version:
- Track: dials, connected calls, human answers, emails sent/delivered/bounced, replies, conversations, placement attempts, admin hours.
- Compute: cost per connect, cost per conversation, cost per placement attempt — each including data cost plus labor.
- Change: refresh cadence, suppression/dedupe, call blocks, and sequencing, then re-measure next month.
Framework: inputs, outputs, levers
Inputs (what you pay for and control)
- Data cost: subscription, per-record fees, enrichment, seats.
- Labor cost: recruiter time spent sourcing, verifying, deduping, and re-sourcing because of contact issues.
- Workflow: call blocks, sequencing, and how outcomes get logged.
- Data quality controls: refresh, verification, suppression.
Seat utilization note: if you pay per seat, compute data cost per active seat — monthly data cost divided by the number of recruiters who actually used the tool that month. Then compare unit costs across active seats only, not total headcount.
Outputs (what you can count)
- Connects (phone)
- Conversations (qualified two-way exchanges)
- Placement attempts (your defined milestone, tracked consistently)
Levers (what moves ROI fast)
- Reduce wasted attempts: bad numbers, bounced emails, duplicates, wrong person.
- Reduce admin time: less cleanup, fewer alternate-number hunts, fewer re-verification loops.
- Increase conversion: better targeting, timing, and sequencing.
You can debate “data quality” indefinitely, or you can price it in dollars per outcome and let the numbers settle the argument.
Step-by-step method
Step 1: Lock definitions
Definitions should not shift depending on who is presenting the numbers.
Connect Rate = connected calls / total dials.
Answer Rate = human answers / connected calls.
Deliverability Rate = delivered emails / sent emails.
Bounce Rate = bounced emails / sent emails.
Reply Rate = replies / delivered emails.
Outreach attempts per placement attempt = total outreach attempts / placement attempts in the same window. Define “placement attempt” as the earliest milestone you can count reliably — often a submittal or presentation — and keep that definition fixed.
ROI definition = (value created − total cost) / total cost. If revenue attribution isn’t clean, use ROI as a comparative measure across sources based on unit costs and time saved.
What counts as a conversation: a two-way exchange that confirms interest and a next step — “send details,” “open to talk Tuesday,” even a clear “not interested.” Voicemails and one-way emails don’t count.
Step 2: Collect the minimum dataset (per source, per month)
- Total dials
- Connected calls
- Human answers
- Emails sent
- Emails delivered
- Emails bounced
- Replies
- Conversations (qualified)
- Total outreach attempts (calls + emails + SMS + other logged attempts)
- Placement attempts (your defined milestone)
- Monthly data cost for the source
- Admin hours spent on verification, cleanup, or re-sourcing caused by contact issues
Step 3: Allocate labor cost
Pick one method and use it consistently, so month-to-month comparisons hold up.
- Method A (fully loaded hourly): hourly cost × hours spent on outreach, verification, and cleanup.
- Method B (blended team rate): one blended hourly rate for the pod × total pod hours on the same activities.
- Method C (percentage allocation): if you can’t track hours yet, allocate a fixed percentage of recruiter time to “contact work” for 30 days, then replace it with tracked hours the following month.
Step 4: Compute the three unit costs
- Cost per connect = (data cost + outreach labor cost) / connected calls
- Cost per conversation = (data cost + outreach labor cost) / conversations
- Cost per placement attempt = (data cost + outreach labor cost) / placement attempts
Then compute waste so you can see where ROI is leaking:
- Wasted dials = total dials − connected calls
- Wasted emails = sent emails − delivered emails
- Wasted admin hours = hours spent fixing contact records and hunting for alternates
Step 5: Compare sources using the same funnel
- Phone funnel: dials → connects → human answers → conversations → placement attempts
- Email funnel: sent → delivered → replies → conversations → placement attempts
ROI calculator
This layout uses a fixed input block (cells B2–B14) so the formulas don’t break when you paste it into a new sheet, and it standardizes what counts as an attempt versus a placement attempt. Copy the table into Google Sheets and enter values only in the Value column.
| Cell | Input / Output | Value | Formula (paste into Value cell) |
|---|---|---|---|
| B2 | Monthly data cost ($) | ||
| B3 | Recruiter hourly cost ($/hr) | ||
| B4 | Hours on outreach + verification + cleanup (hrs) | ||
| B5 | Total dials | ||
| B6 | Connected calls | ||
| B7 | Human answers | ||
| B8 | Conversations (qualified) | ||
| B9 | Emails sent | ||
| B10 | Emails delivered | ||
| B11 | Emails bounced | ||
| B12 | Replies | ||
| B13 | Total outreach attempts (calls+emails+SMS) | ||
| B14 | Placement attempts (your defined milestone) | ||
| B15 | Labor cost ($) | =B3*B4 | |
| B16 | Total cost ($) | =B2+B15 | |
| B17 | Connect Rate (connected calls / total dials) | =IFERROR(B6/B5,0) | |
| B18 | Answer Rate (human answers / connected calls) | =IFERROR(B7/B6,0) | |
| B19 | Deliverability Rate (delivered emails / sent emails) | =IFERROR(B10/B9,0) | |
| B20 | Bounce Rate (bounced emails / sent emails) | =IFERROR(B11/B9,0) | |
| B21 | Reply Rate (replies / delivered emails) | =IFERROR(B12/B10,0) | |
| B22 | Outreach attempts per placement attempt | =IFERROR(B13/B14,0) | |
| B23 | Cost per connect ($) | =IFERROR(B16/B6,0) | |
| B24 | Cost per conversation ($) | =IFERROR(B16/B8,0) | |
| B25 | Cost per placement attempt ($) | =IFERROR(B16/B14,0) |
Comparing sources: for each source, compare B23–B25 (unit costs) and B17–B22 (funnel health). Don’t compare different funnels — say, Source A’s phone connects against Source B’s email replies — and call that a fair ROI comparison.
Diagnostic table
Use this to figure out whether an ROI problem is coming from data quality, workflow, or targeting. Fill it out per source or per campaign.
| Symptom | What it usually means | What to check next | Fix that moves ROI |
|---|---|---|---|
| Low Connect Rate (connected calls / total dials) | Bad numbers, stale records, duplicates, or caller ID patterns getting filtered | Line-type mix, dedupe rate, refresh cadence, disposition hygiene | Refresh + suppression + dedupe; prioritize mobile where appropriate |
| High Connect Rate but low Answer Rate (human answers / connected calls) | You’re connecting to systems, gatekeepers, or non-target contacts | Call windows, role/title accuracy, clinic vs personal numbers | Adjust call blocks; tighten persona filters; improve number labeling |
| Good phone metrics but low conversations | Offer/messaging mismatch or weak sequencing | Opener, follow-up timing, whether email/SMS supports the call | Rewrite opener; add a short follow-up message after missed calls |
| Low Deliverability Rate (delivered emails / sent emails) | Bad emails or poor suppression/verification | Bounce Rate (bounced/sent), suppression list, verification process | Verify + suppress; stop sending to known bad addresses |
| High activity, low placement attempts | Targeting or intake is off; you’re spending attempts on non-movers | Role submittability (comp/schedule/location), licensure constraints, must-haves | Fix intake; tighten targeting; stop burning attempts on non-submittable roles |
Heartbeat.ai is built around connectability and deliverability signals, including ranked mobile numbers by answer probability. Use that kind of signal to reduce wasted attempts, then confirm the impact shows up in your unit costs.
Weighted checklist
Use this when deciding whether to renew a data source, add a second one, or consolidate. Score each item 1–5, multiply by weight, and compare totals.
| Category | Item | Weight | Score (1–5) | Weighted score |
|---|---|---|---|---|
| Connectability | Improves Connect Rate (connected calls / total dials) vs your baseline | 5 | ||
| Conversation yield | Improves conversations per 100 dials (your definition) | 5 | ||
| Email quality | Improves Deliverability Rate (delivered emails / sent emails) and reduces Bounce Rate (bounced / sent) | 3 | ||
| Workflow fit | Supports CRM/ATS logging, dedupe, suppression, and source tagging | 4 | ||
| Freshness | Lets you refresh/re-check contacts right before outreach | 4 | ||
| Admin time | Reduces verification/cleanup hours (tracked) | 5 | ||
| Cost control | Predictable pricing + high seat utilization | 3 |
Scoring tip: score based on your last 30 days of logged outcomes and calculator outputs, not on vendor promises.
Common pitfalls
Measuring activity instead of outcomes
If your model stops at “we sent emails” or “we made calls,” you’ll lose the budget conversation. Tie spend to connects, conversations, and placement attempts instead.
Mixing definitions across recruiters
One recruiter counts a voicemail as a conversation; another counts only a live exchange. Your ROI number will swing every month and nobody will trust it. Write the definitions into the scorecard and enforce them.
Not tagging the source in your CRM/ATS
If you blend multiple data sources in one campaign without tagging, you lose the ability to attribute outcomes. Add a required “contact source” field to the outreach task template.
Ignoring admin time
Bad data creates rework — deduping, hunting alternates, re-verifying, re-sourcing. If you don’t price that time, you’re understating the true cost of low-quality data.
Treating static lists as a permanent fix
Static lists decay. The more durable approach pairs access with refresh, verification, and suppression — if you can’t re-check contacts right before outreach, your cost per outcome will drift upward over time.
How to improve results
Reduce wasted attempts
- Deduplicate before outreach so you’re not paying twice in labor for the same person.
- Suppress known bad contacts — bounces, wrong numbers, opt-outs — so they stop consuming attempts.
- Refresh before you dial for high-value targets and hard-to-reach segments.
Reduce admin time
- Track verification and cleanup minutes as their own task category.
- Separate sourcing time from contact cleanup time.
- Stop having recruiters do detective work when a system can refresh and suppress automatically.
Increase placement attempts per outreach attempt
- Use a consistent sequence — call, short email, call, message where appropriate — and measure conversion at each step.
- Fix intake first: if a role isn’t submittable on comp, schedule, or location, don’t burn attempts on it.
Running the measurement
- Step A: Pick a fixed window, such as the last 30 days, and freeze it.
- Step B: Export activity counts (dials, connected calls, human answers, emails sent/delivered/bounced, replies) and outcomes (conversations, placement attempts).
- Step C: Allocate costs using one labor method and the data cost for that source.
- Step D: Compute unit costs with the calculator and track the trend month over month.
- Step E: Change one lever at a time — refresh cadence, suppression rules, call blocks, sequencing — so you can attribute the improvement.
Legal and ethical use
Use contact data for legitimate recruiting outreach with clear professional intent. Respect opt-outs immediately, avoid sensitive inferences, and follow applicable privacy and communications laws in your jurisdiction.
- Maintain suppression lists (bounces, opt-outs, wrong person).
- Document your process for honoring opt-outs and correcting records.
- Train recruiters on respectful cadence and stop rules.
Evidence and trust notes
How we think about measurement and data quality at Heartbeat.ai is documented here: trust methodology for data quality and verification. It explains how we define verification, refresh, and suppression in practice so teams can audit what “quality” means operationally.
Spreadsheet formula reference for teams implementing the calculator in Google Sheets: Google Sheets function reference.
FAQs
What’s the fastest way to prove ROI on provider contact data?
Show unit economics: cost per connect, cost per conversation, and cost per placement attempt — each including data cost plus the admin time caused by bad data and rework.
What’s the difference between connect rate and answer rate?
Connect Rate = connected calls / total dials. Answer Rate = human answers / connected calls. Connect tells you whether the number works; answer tells you whether a human picked up.
How should I define “placement attempt” for this model?
Pick the earliest milestone you can count reliably, often a submittal or presentation, and keep it consistent across teams and months. The goal is comparable measurement, not perfection.
Should I include email metrics if my team is phone-first?
Yes, if you send any email at all. Deliverability Rate and Bounce Rate quantify wasted attempts, and Reply Rate helps you compare messaging and list quality across sources.
How do I improve ROI without adding recruiter headcount?
Reduce wasted attempts through refresh, suppression, and dedupe, and reduce the admin time spent fixing contact records. Then tighten sequencing so more attempts convert into conversations and placement attempts.
Next steps
- Run the ROI calculator for the last 30 days for each contact data source you use.
- Pick one lever to change next month — refresh cadence, suppression rules, call blocks, or sequencing — and re-run the same scorecard.
- For metric hygiene, read: connect rate vs answer rate (and how to use both).
- For call productivity, use: call block math for physician recruiting.
- To reduce decay-driven waste, align on: provider data refresh cadence.
- If you want to operationalize this with Heartbeat.ai, start free search & preview data.
About the Author
Ben Argeband is the Founder and CEO of Swordfish.ai and Heartbeat.ai. With deep expertise in data and SaaS, he has built two successful platforms trusted by over 50,000 sales and recruitment professionals. Ben’s mission is to help teams find direct contact information for hard-to-reach professionals and decision-makers, providing the shortest route to their next win. Connect with Ben on LinkedIn.

