Do you know that over 70% of healthcare organizations now utilize advanced reporting tools for healthcare analytics? However, with so many tools out there, it’s a real challenge to pinpoint the most effective ones.
So why are these tools so important? In the world of medical analytics, reporting tools are the backbone for informed decisions and enhanced patient care.
That’s why we conducted extensive research and identified the 10 best reporting tools for healthcare analytics. In our analysis, we provide insights into both their strengths and limitations.
We invite you to look into our comprehensive guide and explore each option. Stay with us till the end to discover the healthcare data platform that aligns perfectly with your needs. Trust us, you don’t want to miss this!
What’s on this page:
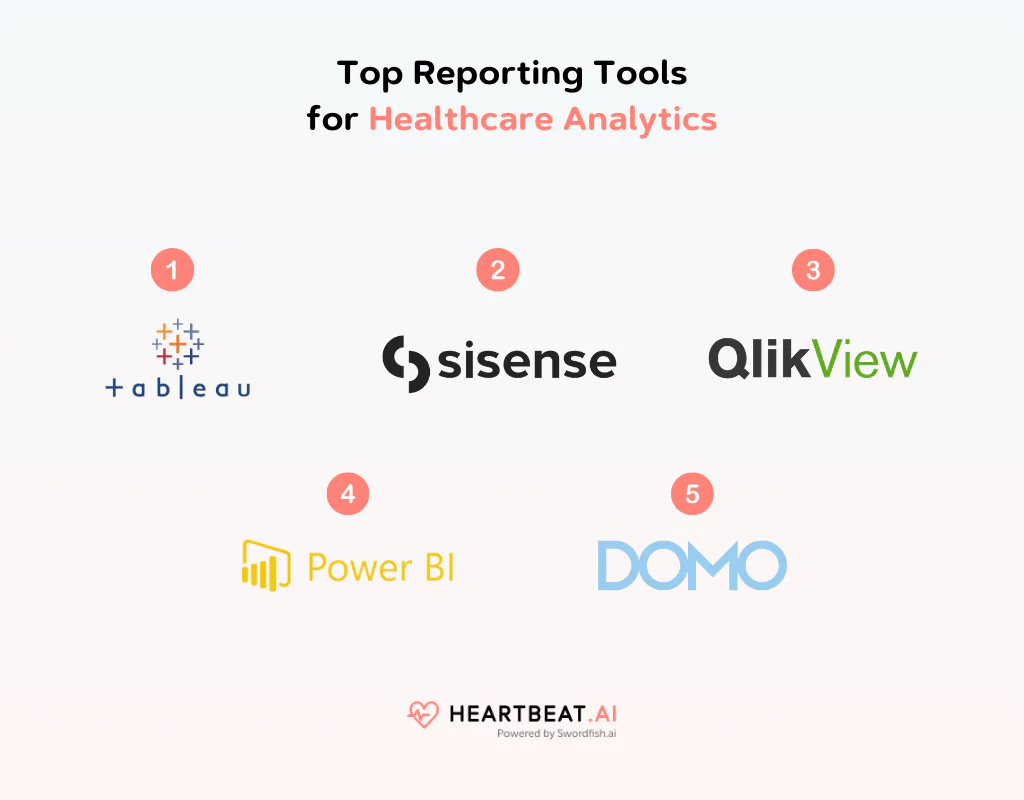
Quick List of 10 Healthcare Analytics Software Companies
Here is a list of healthcare analytics platforms:
- Tableau: Best for intuitive visual analytics, interactive dashboards, and user-friendly data exploration.
- Sisense: Best for integrating complex data, customizable dashboards, and scalable BI solutions.
- QlikView: Best for data integration, flexible data discovery, and personalized, interactive reporting.
- Power BI: Best for comprehensive data analysis, seamless Microsoft integration, and cost-effectiveness.
- Domo: Best for connecting varied data sources, real-time visualization, and enterprise scalability.
- Clarify Health: Best for predictive analytics for healthcare outcomes, improving patient care
- Improvado: Best for simplified data integration and reporting for marketing professionals.
- Optum: Best for comprehensive healthcare analytics and services, optimizing healthcare management.
- Google Analytics: Best for website and app performance tracking, and insights for digital marketers.
- Zoho Analytics: Best business intelligence platform for data analysis, reporting, and visualization.
3 Best Reporting Tools for Healthcare Analytics: Comparison Chart
Here is a comparison chart of the top healthcare analytics reporting tools:
| Reporting Tool | Data Visualization | Customization | Data Integration |
| Tableau | Exceptional, interactive visualizations | High customization capabilities | Strong integration with multiple data sources |
| Sisense | Strong, with emphasis on dashboard customization | Extensive customization options | Excellent at integrating complex data sets |
| QlikView | Advanced, interactive visualizations | Flexible customization | Strong in data integration and aggregation |
3 Top Reporting Tools for Healthcare Analytics
In the world of healthcare analytics, having the right reporting tools is crucial. In this article, we’ll look into the top companies that offer user-friendly and effective solutions for healthcare data reporting.
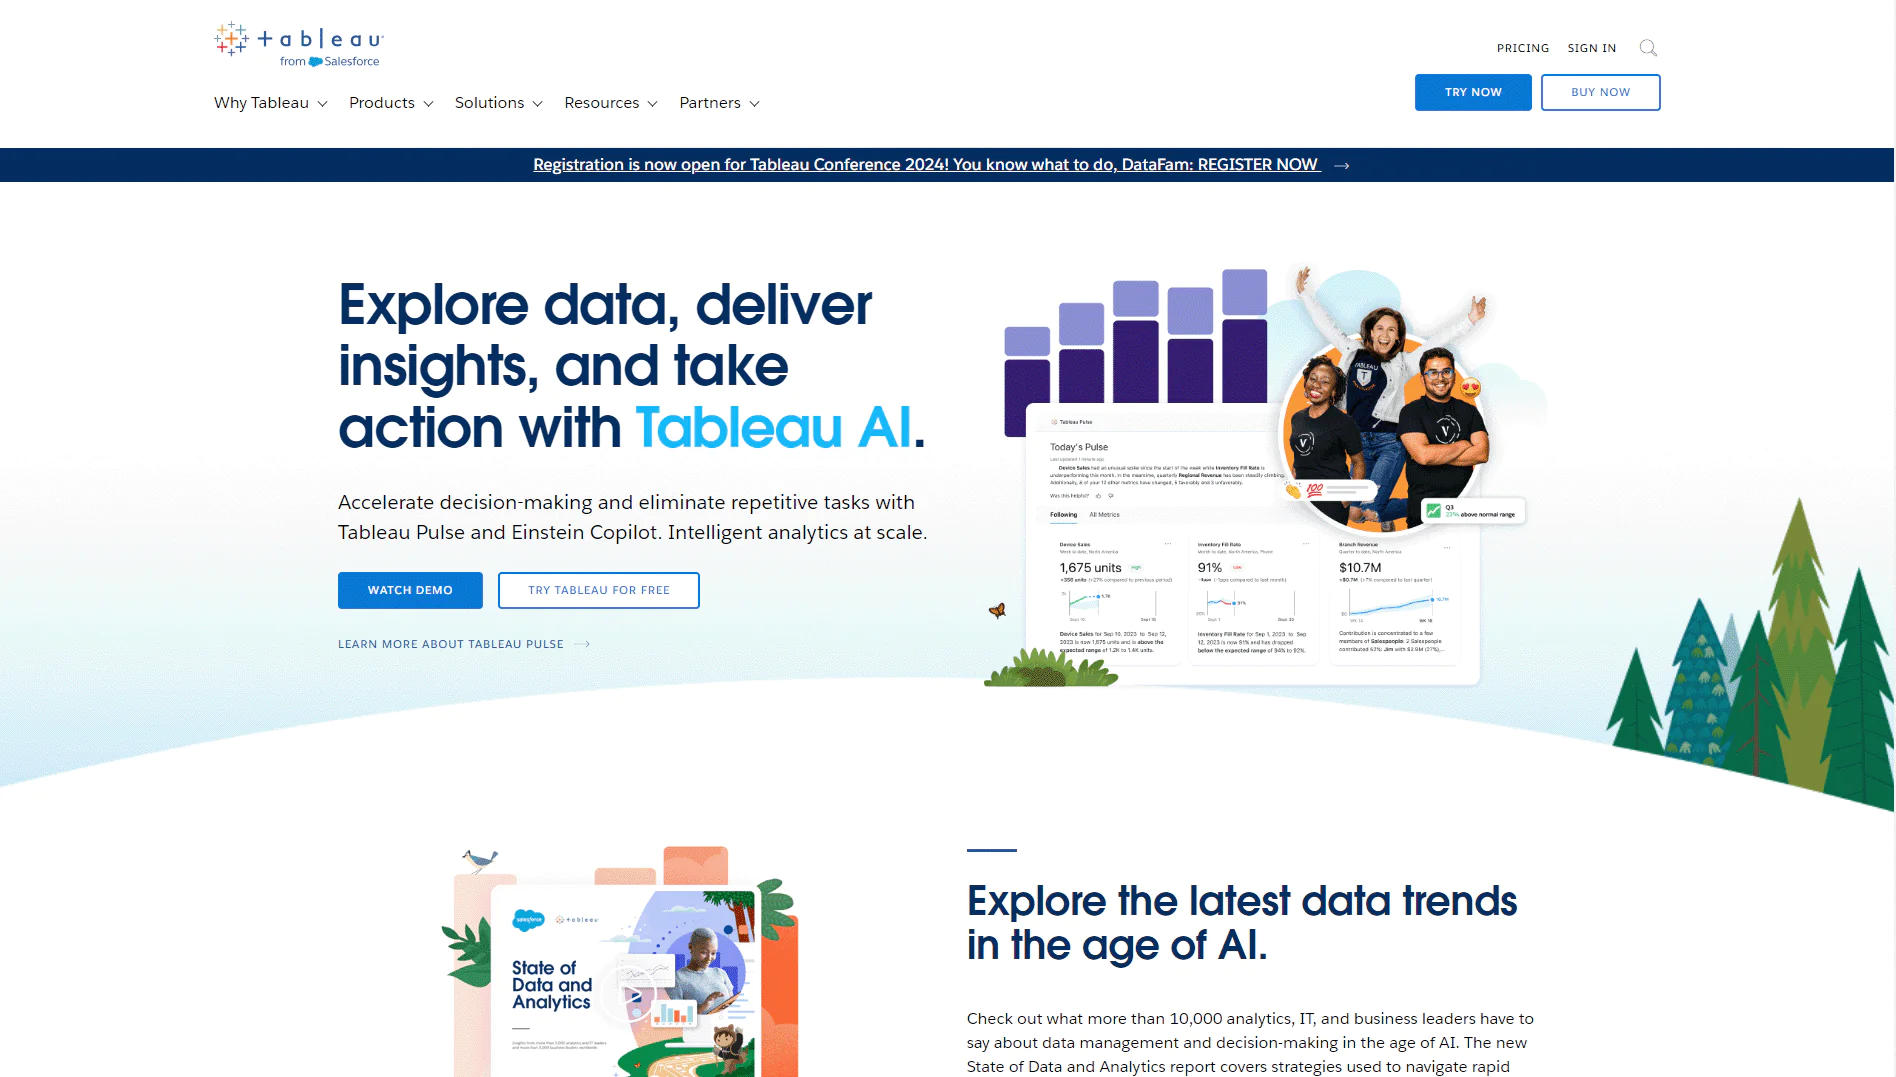
1. Tableau
Tableau is a powerful data visualization tool that helps people understand their data easily. It’s important because it turns complicated numbers into visual charts and graphs that make sense.
For healthcare, Tableau is great because it can show patient data, hospital performance, and trends clearly. It helps doctors and administrators make better decisions to improve patient care. That’s why Tableau is among the top tools for healthcare analytics – it simplifies complex data for better healthcare decisions.
About Tableau
- Founding Team: Christian Chabot, Chris Stolte, Andrew Beers and Pat Hanrahan
- Founding Year: 2003
- Company Size: 4,181
Features of Tableau
Tableau is a software tool that specializes in visual analytics and business intelligence. Here’s a simple explanation of its key features:
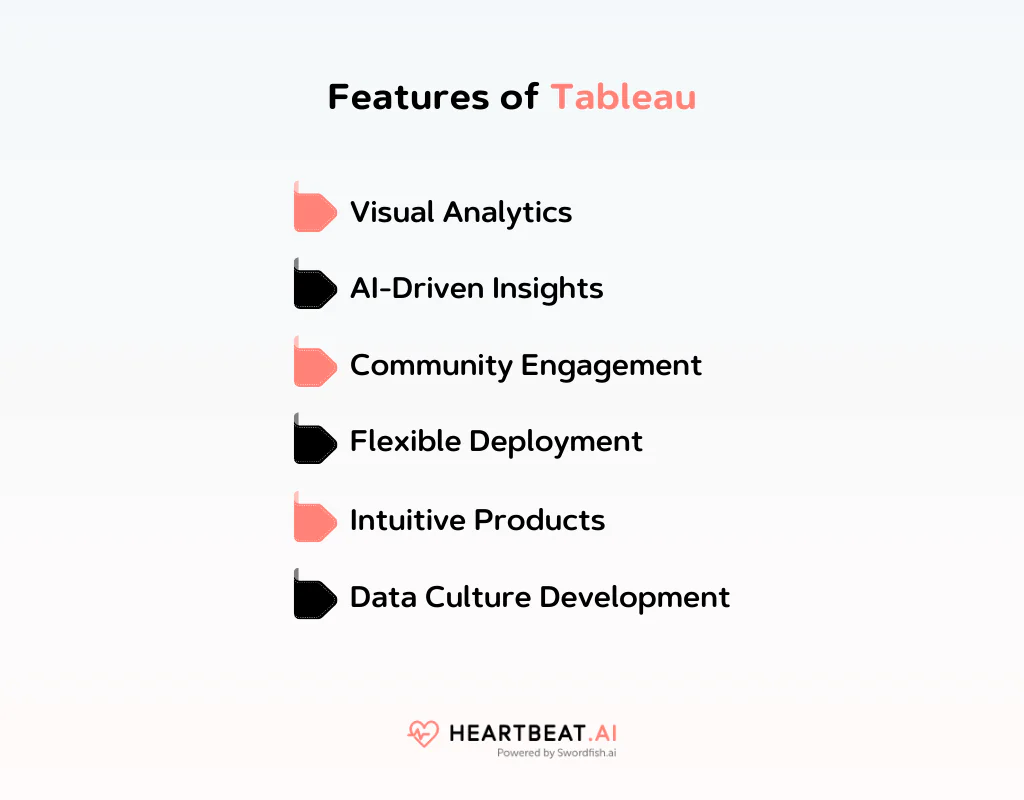
Visual Analytics
Tableau is designed to help people see and understand data. It’s a platform that transforms the way data is used to solve problems, making it easier for organizations of all sizes to be more data-driven.
AI-Driven Insights
The website showcases Tableau AI, which includes Tableau Pulse and Einstein Copilot. These tools are designed to accelerate decision-making and automate repetitive tasks, providing intelligent analytics at scale.
Community Engagement
Tableau emphasizes the importance of its community, known as the Tableau Community. With over a million members, it offers a space for users to connect, learn, grow, and find inspiration.
Flexible Deployment
Tableau can be deployed in various environments – cloud, on-premises, or integrated with Salesforce CRM. This flexibility allows it to cater to different organizational needs.
Intuitive Products
The platform is built with the belief that data analysis should be about asking questions, not learning complex software. Tableau focuses on intuitive use and visual best practices to facilitate seamless data exploration.
Data Culture Development
Tableau positions itself as a partner in building a data culture within organizations. They assist customers in scaling Tableau usage, improving operations, and enhancing customer service through data analytics.
Pros
- Strong data visualization tool with diverse chart options for in-depth analysis.
- User-friendly interface for both beginners and experts in data visualization.
- Seamless data integration capabilities, connecting to various data sources.
- Active online community for support and sharing best practices.
- Rapid insights generation, empowering quick decision-making.
Cons
- High licensing costs can be prohibitive for small businesses.
- Learning curve may be steep, particularly for complex visualizations and calculations.
Our Review of Tableau
Tableau is a powerful data visualization tool that we’ve extensively researched and analyzed. One standout feature we appreciate is its user-friendly interface. Creating charts and graphs is a breeze, even for those without a deep data background. We also like the strong range of data sources it supports, making data integration smooth.
However, we’ve noticed some downsides. Tableau can be resource-intensive, and large datasets might slow it down. Also, while it excels at visualization, some advanced analytics features could be more user-friendly. Overall, for data visualization, Tableau remains a top choice in our analysis.
2. Sisense
Sisense is a data analytics platform that helps people make sense of their data. It’s important because it turns lots of information into easy-to-understand reports and dashboards.
In healthcare, Sisense is valuable because it can analyze patient records, hospital operations, and trends, helping healthcare professionals make informed decisions. Sisense is one of the top tools for healthcare analytics because it simplifies complex data, making it easier to improve patient care and hospital efficiency.
About Sisense
- Founding Team: Elad Israeli, Eldad Farkash, Aviad Harell, Guy Boyangu and Adi Azaria
- Founding Year: 2004
- Company Size: 800+
Features of Sisense
Sisense is a platform that specializes in integrating intelligent analytics into products, focusing on AI-powered analytics with various coding capabilities. Here’s a simple explanation of its key features:
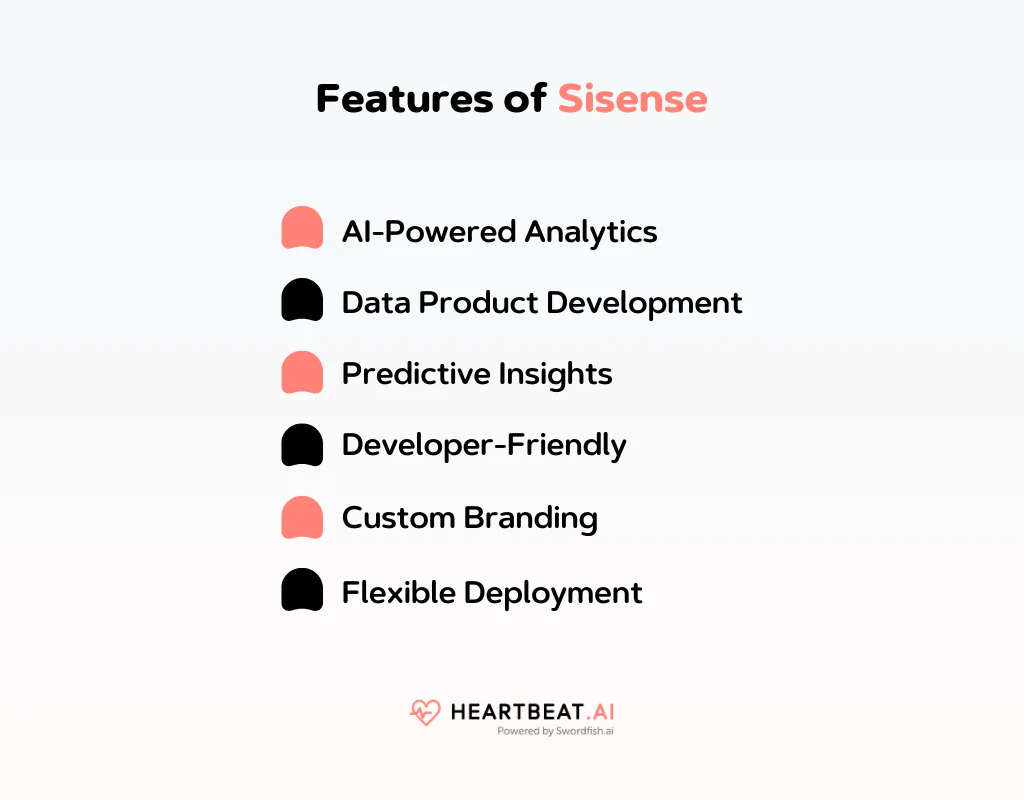
AI-Powered Analytics
Sisense Fusion Analytics Platform allows you to build AI-powered analytics into your products. This means you can convert data into actionable insights and revenue, catering to both technical and non-technical users with pro-code, low-code, and no-code options.
Data Product Development
The platform is designed to drive engagement and add value to solutions by creating intuitive data products. This helps in standing out against competitors and sustaining growth with data-hungry users.
Predictive Insights
Sisense offers tools for developing AI predictions, including machine learning models and an analytics engine. This feature enables the creation of data applications that are not only quick but also cost-effective.
Developer-Friendly
Sisense is built for embedding into products, with features like Git integration and strong APIs and SDKs. This makes it a favorable choice for development teams looking to integrate analytics seamlessly into their products.
Custom Branding
The platform allows for a seamless user experience that aligns with your brand’s design vision, UI, and UX. This means analytics can be integrated without distracting from the overall user experience.
Flexible Deployment
Sisense operates in any cloud environment and offers various deployment options, including cloud, on-premises, hybrid, and SaaS. This flexibility is crucial for businesses with different infrastructure needs.
Pros
- Embeddable analytics enables integration of data insights into applications and products seamlessly.
- AI-driven insights provide automated, actionable recommendations.
- Scalable architecture accommodates growing data needs.
- Customizable dashboards tailored to specific business requirements.
- Real-time data access for up-to-the-minute decision-making.
Cons
- Complex data modeling may require advanced technical expertise.
- Resource-intensive implementation and maintenance may demand significant IT resources.
Our Review of Sisense
In our comprehensive analysis and research of Sisense, we’ve observed its strengths and weaknesses. We appreciate its user-friendly interface, which makes data analysis accessible. The ability to blend data from various sources is a definite plus.
However, we’ve encountered occasional performance issues with very large datasets, which can be a drawback. Overall, Sisense offers a straightforward approach to data analysis, but it may have limitations with extensive data processing.
3. QlikView
QlikView is a data analysis tool that helps people understand their information. It’s essential because it transforms data into clear reports and visuals.
In healthcare, QlikView is crucial because it can analyze patient data, medical trends, and hospital performance. This helps healthcare professionals make smarter decisions and enhance patient care.
QlikView stands out as a top tool for healthcare analytics due to its ability to simplify complex data. This aids in better healthcare management and patient outcomes.
About QlikView
- Founding Team: Björn Berg and Staffan Gestrelius
- Founding Year: 1993
- Company Size: 2,500
Features of QlikView
Here’s a simple overview of what QlikView offers:
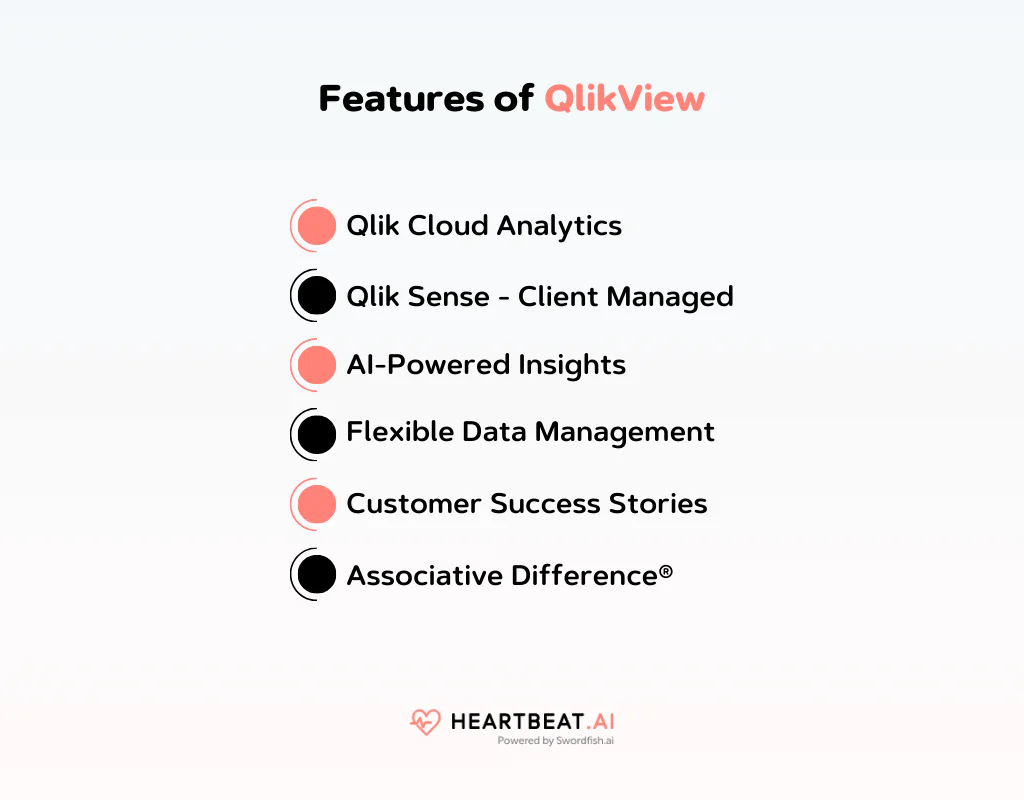
Qlik Cloud Analytics
This is a cloud-based SaaS (Software as a Service) deployment of Qlik’s analytics solutions. It brings the power of Qlik’s analytics to a cloud environment, making it more accessible and scalable.
Qlik Sense – Client Managed
For organizations that prefer or require on-premises solutions, particularly those in highly regulated industries, Qlik Sense offers a strong option. It maintains the on-premises approach while providing modern analytics capabilities.
AI-Powered Insights
Both Qlik Cloud Analytics and Qlik Sense enhance and augment human intuition with AI-powered insights. This integration of artificial intelligence helps teams move from passive data analysis to active analytics, enabling real-time collaboration and action.
Flexible Data Management
These platforms offer flexibility in how and where you manage data. Whether you prefer cloud-based analytics or on-premises solutions, Qlik provides options to store, transform, and analyze data according to your organizational needs.
Customer Success Stories
The website features testimonials from various businesses that have successfully integrated Qlik’s solutions. These stories highlight how Qlik has helped companies make strategic decisions, improve efficiency, and provide customizable insights to customers.
Associative Difference®
Qlik’s unique approach to data analytics, known as the Associative Difference®, is designed to overcome the limitations of traditional query-based tools. This allows for more intuitive and comprehensive data exploration.
Pros
- Associative data model allows intuitive exploration of data relationships and connections.
- Interactive dashboards offer dynamic, user-driven data exploration.
- Strong scripting capabilities enable advanced data transformations and calculations.
- Scalable platform adapts to growing data volumes and users.
- Self-service analytics empowers users to create and customize their reports.
Cons
- Limited mobile support and responsiveness.
- Hardware requirements for optimal performance can be resource-intensive.
Our Review of QlikView
In our thorough analysis and research of QlikView, we’ve noticed its strengths and weaknesses. We appreciate its powerful data visualization capabilities, enabling us to gain valuable insights. The associative data model is a unique feature that facilitates interactive exploration.
However, we’ve found that setting up and maintaining the system can be complex, and the learning curve may be steep for some users. Overall, QlikView offers strong data visualization, but it may require more effort to get started.
Other 7 Companies of Reporting Tools for Healthcare
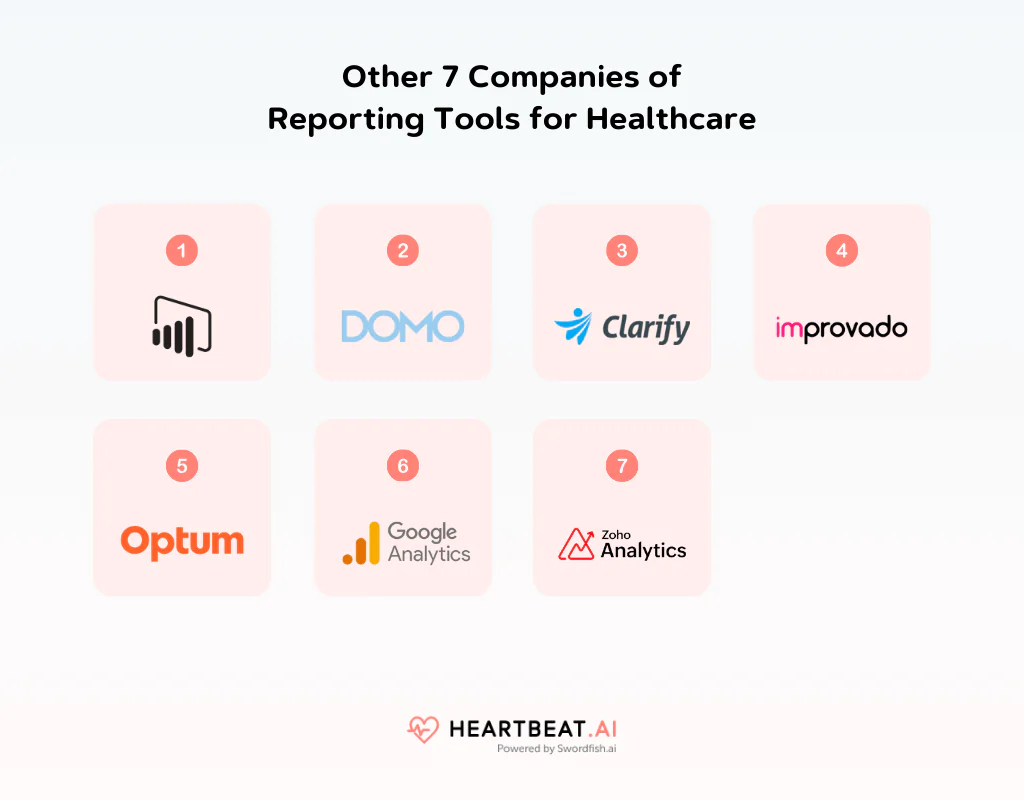
Explore 7 more companies providing reporting tools for healthcare, revolutionizing data analysis in the medical field. Discover their cutting-edge solutions and impact on healthcare reporting.
1. Power BI
Power BI helps businesses visualize data and make decisions. It’s crucial because it turns complex data into easy-to-understand reports. For healthcare, Power BI is great because it can handle large amounts of health data, helping hospitals and clinics improve care and efficiency.
About Power BI
- Founding Team: Thierry D’Hers and Amir Netz
- Founding Year: 2010
- Company Size:
2. Domo
Domo offers a platform to connect, visualize, and understand business data. It’s needed for making informed decisions quickly. In healthcare, Domo shines by offering real-time data tracking and analysis, aiding in patient care and operational improvements.
About Domo
- Founding Team: Josh James
- Founding Year: 2010
- Company Size: 824
3. Clarify Health
Clarify Health specializes in analyzing healthcare data to improve patient outcomes. They’re essential for turning vast health data into actionable insights. Clarify Health stands out in healthcare for its precise analytics and patient journey mapping, helping providers and payers enhance care quality.
About Clarify Health
- Founding Team: Jean Drouin and Todd Gottula
- Founding Year: 2015
- Company Size: 254
4. Improvado
Improvado consolidates marketing data for businesses to analyze performance. It’s crucial for simplifying data management without coding. Improvado is noteworthy in healthcare for its ability to integrate data from various sources, making it easier for health organizations to gain insights and optimize marketing strategies.
About Improvado
- Founding Team: Daniel Kravtsov
- Founding Year: 2015
- Company Size: 90
5. Optum
Optum focuses on health services and innovation to help improve healthcare systems. They’re needed for their expertise in health data analytics and care solutions. Optum stands out in healthcare reporting by offering comprehensive data management and analytics services, helping providers deliver better patient care.
About Optum
- Founding Team: Andrew Witty
- Founding Year: 2011
- Company Size: 72,664
6. Google Analytics
Google Analytics tracks and reports website traffic, crucial for understanding user behavior. In healthcare, it’s valuable for analyzing patient engagement with online health services. Google Analytics is distinguished by its ability to provide insights into patient interactions, helping healthcare providers improve online services and patient care.
About Google Analytics
- Founding Team: Paul Muret, Jack Ancone, Brett Crosby and Scott Crossby
- Founding Year: 2005
- Company Size: 50
7. Zoho Analytics
Zoho Analytics provides a self-service BI and analytics platform. It’s important for creating insightful reports and dashboards. In healthcare, Zoho Analytics excels by offering easy-to-use data analysis tools, enabling health organizations to better understand their operations and patient needs, leading to improved healthcare delivery.
About Zoho Analytics
- Founding Team: Sridhar Vembu and Tony Thomas
- Founding Year: 1996
- Company Size: 15,000+
What To Consider When Choosing the Best Healthcare Analytics Reporting Tools?
Choosing the best healthcare analytics reporting tool is vital for effectively managing and interpreting the vast amounts of data generated in the healthcare sector. Here’s what to consider when selecting such a tool:
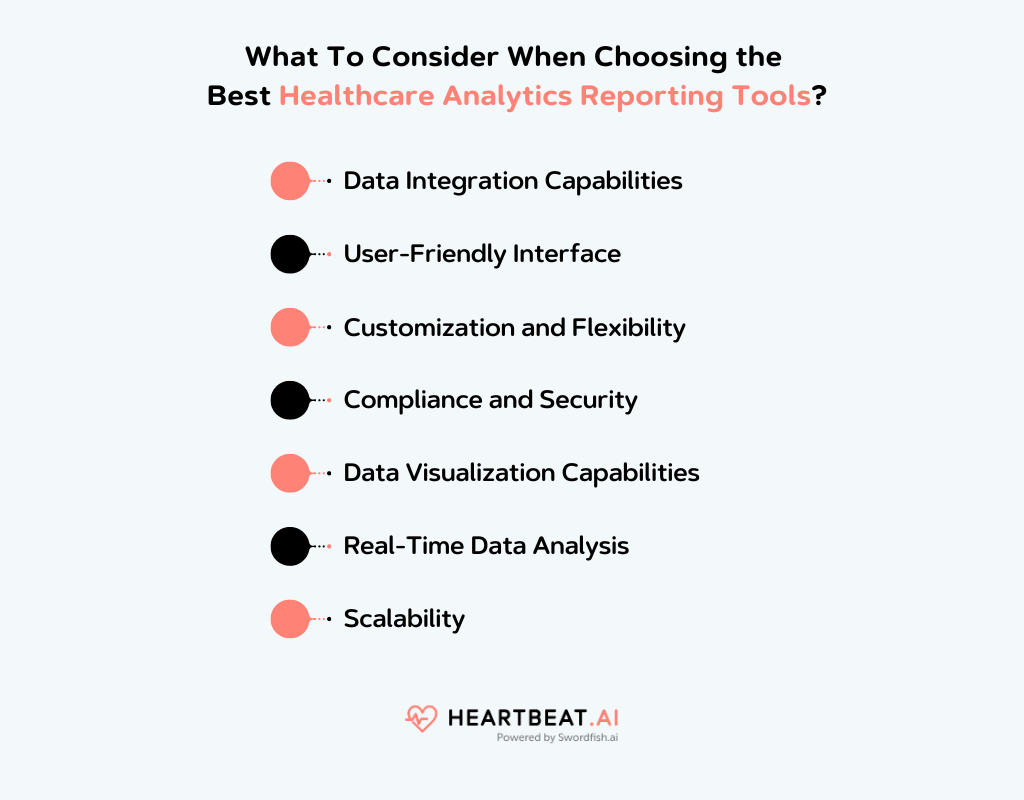
Data Integration Capabilities
The tool should be able to integrate with various data sources within your healthcare system, including Electronic Health Records (EHR), billing systems, and patient management systems. This ensures a comprehensive view of data.
User-Friendly Interface
Always look for a tool with an intuitive and easy-to-navigate interface. Healthcare professionals should be able to use it without needing extensive training in data science.
Customization and Flexibility
The tool should offer customization options to generate reports that meet the specific needs of your organization. Flexibility in creating and modifying reports is crucial for addressing diverse analytical requirements.
Compliance and Security
You should ensure the tool complies with healthcare regulations like HIPAA in the US. Data security and privacy are important, so check for features like encryption, access controls, and audit trails.
Data Visualization Capabilities
Effective data visualization is key in analytics. The tool should offer a range of visualization options (graphs, charts, dashboards) to help users easily interpret complex data sets.
Real-Time Data Analysis
The ability to analyze data in real time can be crucial for making timely decisions in patient care and operational management.
Scalability
As your healthcare organization grows, the tool should be able to handle increasing data volumes and more complex analytical needs without compromising performance.
Conclusion
As we sum up, we’ve looked into the best reporting tools for healthcare analytics, highlighting their features, pros, cons, and more.
These tools are essential in healthcare analytics for their ability to transform complex data into actionable insights, enhancing patient care and operational efficiency. Each tool has unique strengths customized to different needs.
As you consider your options, remember that the right tool can significantly simplify your data analysis and decision-making processes. Now if you’re the tool provider looking for the best healthcare providers’ contact list then you can try Heartbeat AI
We hope this guide helps you find the perfect reporting tool that aligns with your specific healthcare analytics requirements.
Frequently Asked Question
What types of data can be analyzed using healthcare reporting tools?
Healthcare data management software can analyze patient records, clinical outcomes, billing and claims data, patient satisfaction surveys, and operational data.
Are healthcare reporting tools compliant with healthcare data privacy regulations like HIPAA?
Yes, reputable healthcare reporting tools prioritize data security and compliance with regulations like HIPAA. They often include features for secure data storage, access controls, and audit trails to protect patient information.
Can healthcare reporting tools integrate with electronic health record (EHR) systems?
Yes, many reporting tools can integrate with EHR systems, allowing healthcare organizations to access and analyze patient data seamlessly. This integration enhances the accuracy and depth of analytics.